A stock signal is a starting gun, not a finish line.
When WealthGlider surfaces a Buy or Sell candidate, the useful question is not "Should I blindly act?" The useful question is: what would have to be true on the chart for this signal to deserve more research?
Affiliate disclosure: WealthGlider may earn compensation if you sign up or purchase through TradingView links on this page. Affiliate compensation does not affect model output, ticker ranking, or signal direction.
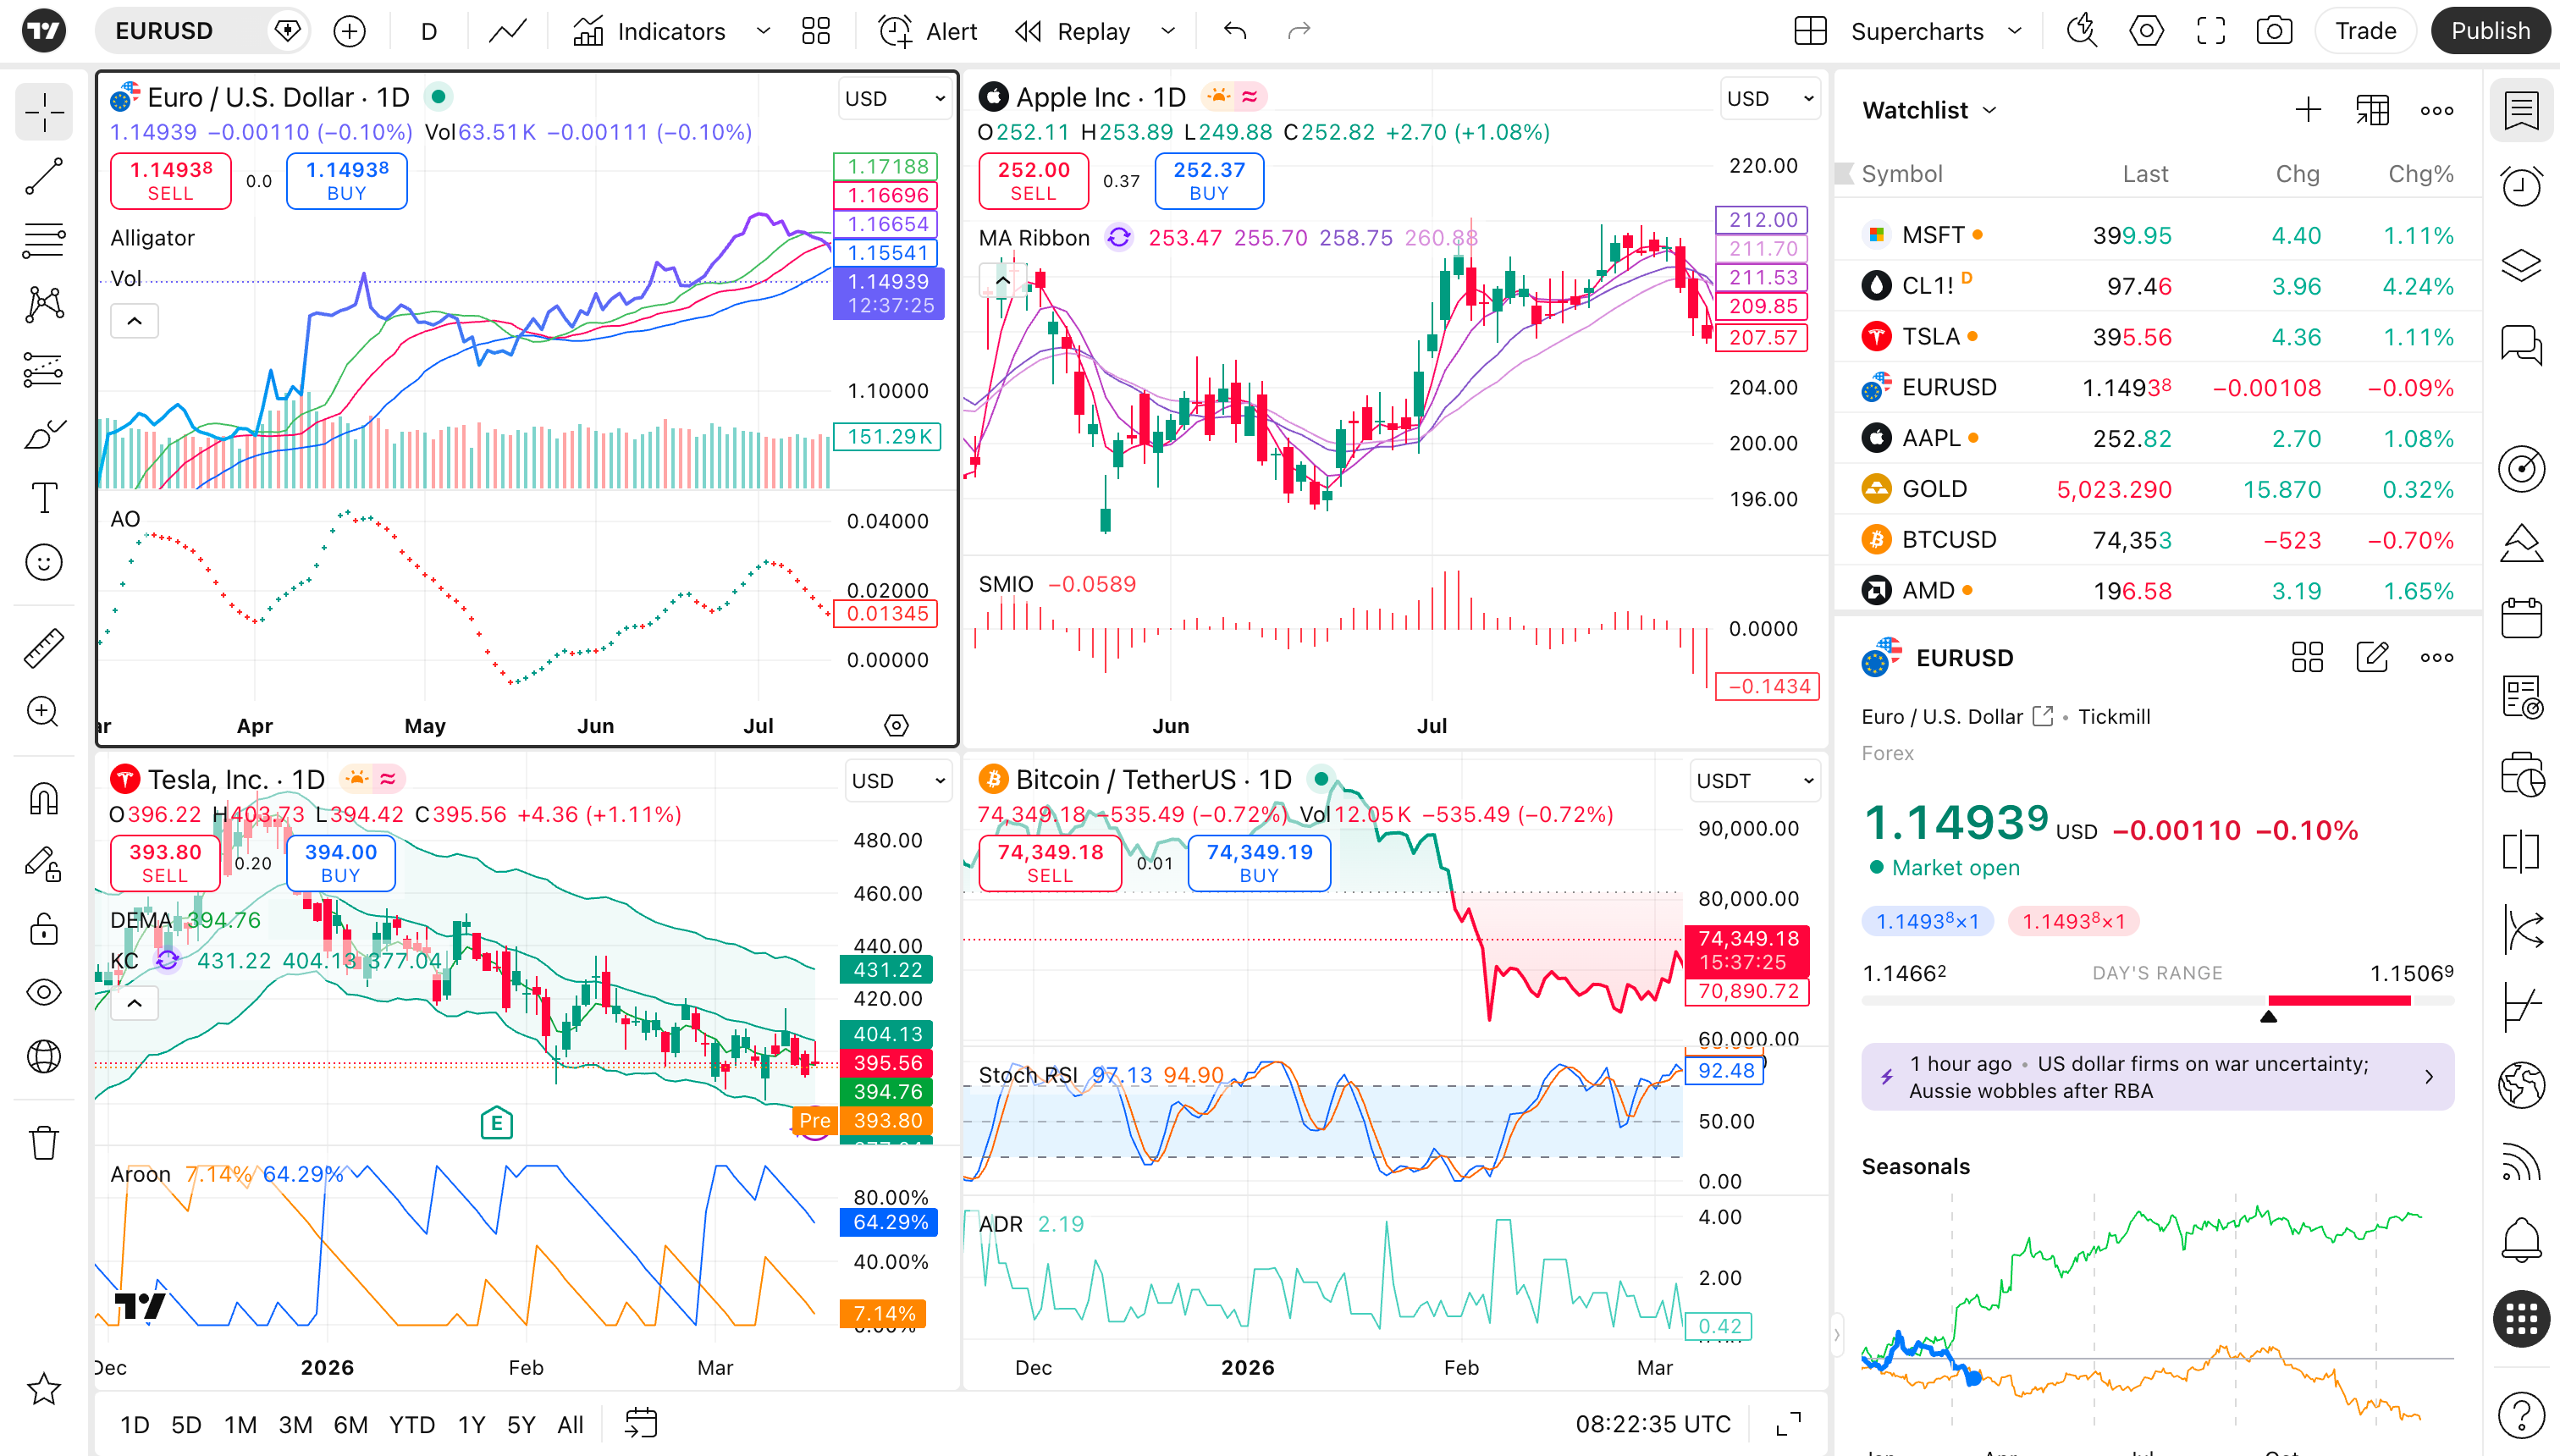
The 90-Second Chart Check
Open the ticker and look for four things before you let the story get complicated:
- trend direction
- nearby support and resistance
- volume behavior
- whether the move is early, mature, or exhausted
That is enough to avoid the most common mistake: seeing a model score and forgetting that price can already be stretched.
Step 1: Ask If Price Is Cooperating
For a Buy signal, look for constructive behavior:
- higher lows
- a breakout attempt
- a recovery from a sharp overreaction
- price holding above a recent support area
For a Sell signal, look for pressure:
- lower highs
- repeated rejection near resistance
- a break below support
- heavy downside candles
If the chart is fighting the signal, slow down. Conflicting evidence is not a failure. It is information.
Step 2: Draw The Obvious Zones
Do not draw twenty lines. Draw the zones a normal human would see in ten seconds.
Useful zones usually appear where price:
- reversed hard
- stalled repeatedly
- gapped through an area
- consolidated before a large move
A Buy signal sitting just under resistance is different from a Buy signal reclaiming support. A Sell signal after a vertical collapse is different from a Sell signal breaking down from a clean range.
Step 3: Check Volume For Participation
Volume answers a simple question: did anyone else care?
Watch for:
- breakouts on weak volume
- selloffs on heavy volume
- quiet pullbacks after strong advances
- one-day news spikes that distort the signal
A good model candidate can still be noisy. Volume helps you separate structure from noise.
Step 4: Decide Before You Rationalize
After the review, force the chart into one bucket:
| Bucket | What it means |
|---|---|
| Confirming | Chart behavior supports the signal direction |
| Conflicting | Chart behavior weakens the setup |
| Too extended | Direction may be right, but timing risk is high |
| Event-driven | News or earnings dominate the setup |
| Inconclusive | Nothing useful enough to change your view |
This matters because an honest "inconclusive" is better than a confident fantasy.
Use TradingView For The Inspection Pass
TradingView is useful here because it makes the inspection step fast: open the ticker, compare timeframes, mark levels, check volume, and save the symbol to a watchlist.
Chart check: Open the ticker in TradingView and mark trend, support, resistance, and volume before doing deeper research.
Open TradingView for chart inspection
Affiliate link. TradingView says eligible referred users receive a $15 discount coupon when they register and purchase through a partner link. Eligibility, coupon terms, and offers can change.
The Point
The goal is not to make the chart say yes. The goal is to decide whether the model signal has enough real-world price context to deserve your next ten minutes.
WealthGlider is educational software, not personalized financial advice. Your portfolio, risk tolerance, taxes, and liquidity needs are yours to evaluate.