A WealthGlider signal should make you curious, not reckless.
The model is pointing at a stock worth studying. Your job is to inspect whether the market structure makes the idea cleaner, messier, or too stretched to touch. This is where a charting workflow earns its keep.
Affiliate disclosure: WealthGlider may earn compensation if you sign up or purchase through TradingView links on this page. Compensation does not affect WealthGlider model output, recommendation ranking, or signal direction.
First: Capture The Signal Context
Before opening a chart, write down the basics:
- ticker
- Buy or Sell direction
- 30-trading-session horizon
- top model drivers
- whether the setup looks like trend, reversal, volatility, momentum, or event behavior
This keeps you from doing the classic chart-analysis magic trick: staring at a chart until it tells you the story you already wanted.
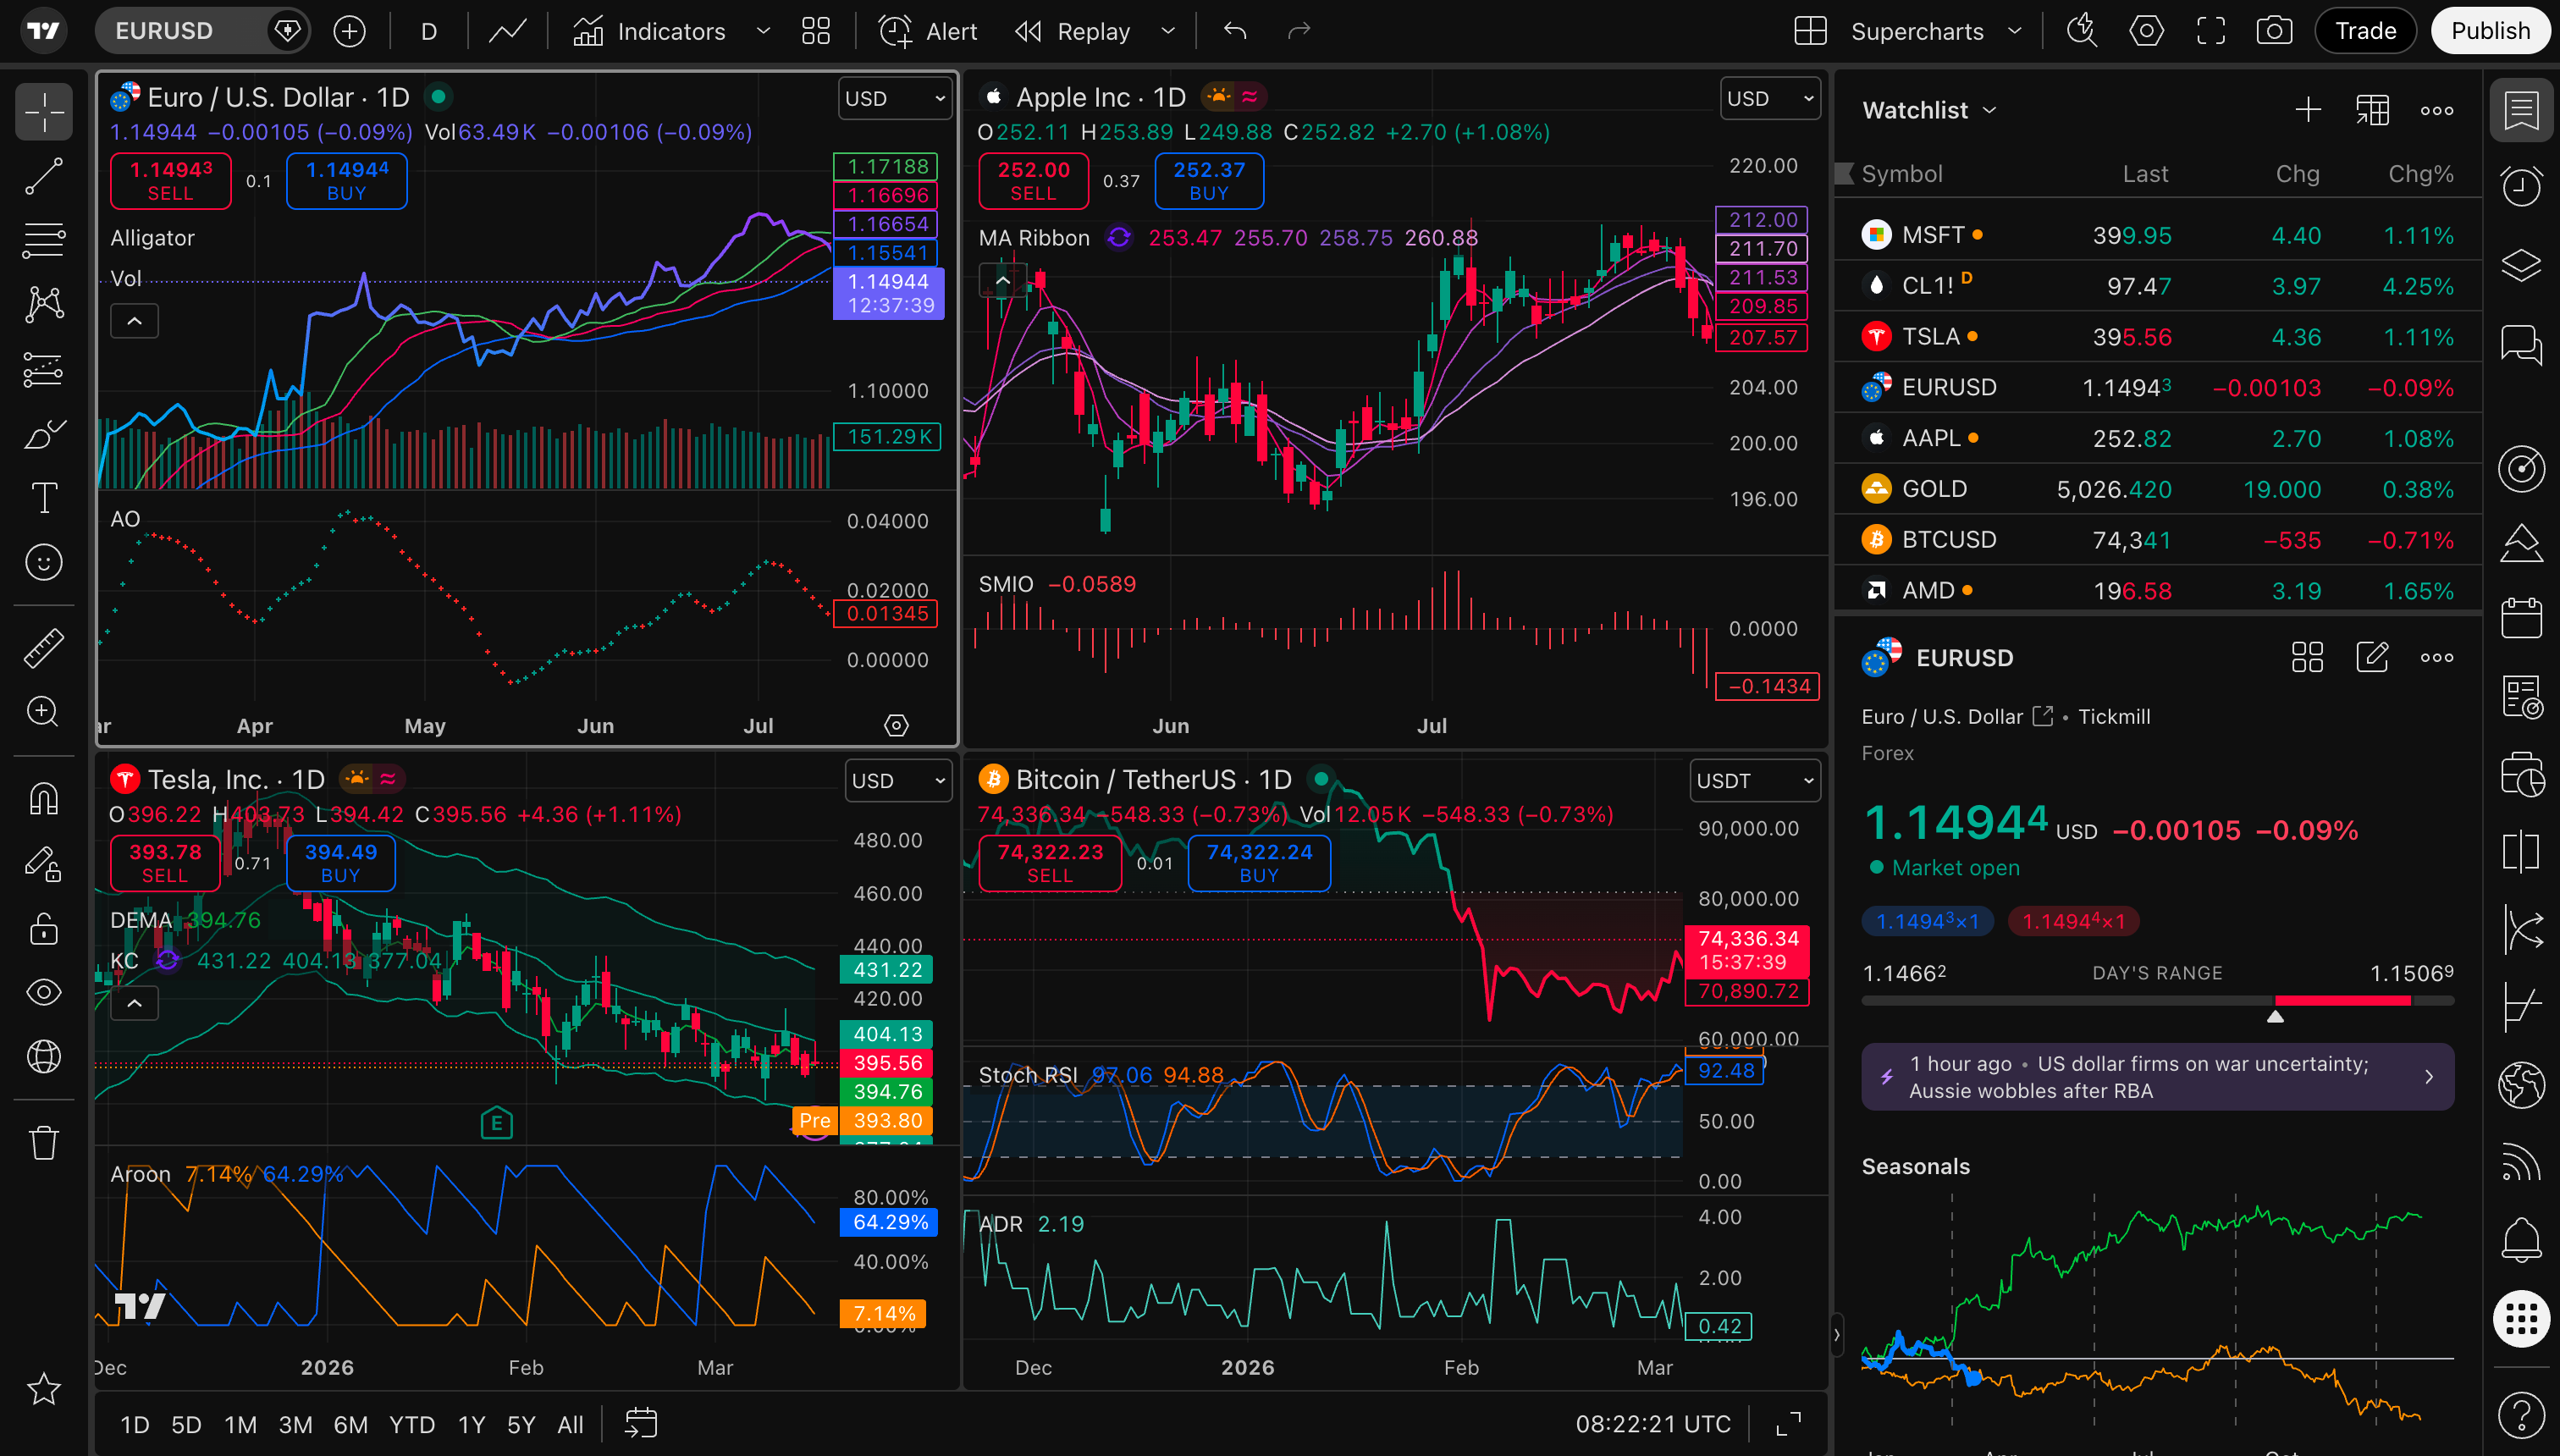
Check The Trend
Look at several windows, not just today's candle:
- 1 month
- 3 months
- 6 months
- 1 year
For a Buy signal, ask whether price is stabilizing, breaking out, or recovering from an overreaction.
For a Sell signal, ask whether price is deteriorating, rejecting resistance, or losing support.
The goal is not to force agreement. The goal is to find confirming evidence, conflicting evidence, or timing risk.
Mark Support And Resistance
Draw the obvious zones where price recently reversed, stalled, or accelerated.
For a Buy signal:
- Is price near support?
- Is it breaking above resistance?
- Is it already far above a recent base?
For a Sell signal:
- Is price failing at resistance?
- Has it broken below support?
- Is it already deeply oversold?
A good research candidate can still be poorly timed. The chart helps you notice that before you get attached.
Read Volume Like A Participation Meter
Volume can separate a real move from a lonely candle.
Ask:
- Did the recent move happen on above-average volume?
- Are down days or up days carrying more volume?
- Is volume drying up during consolidation?
- Did earnings or news create a one-day distortion?
Volume does not make a signal right. It tells you whether the move had company.
Use Indicators Sparingly
A clean review does not need an indicator zoo.
Start with:
- moving averages
- relative strength
- RSI or another momentum gauge
- volume trend
Do not keep adding indicators until the chart agrees with the signal. That is just overfitting with extra steps.
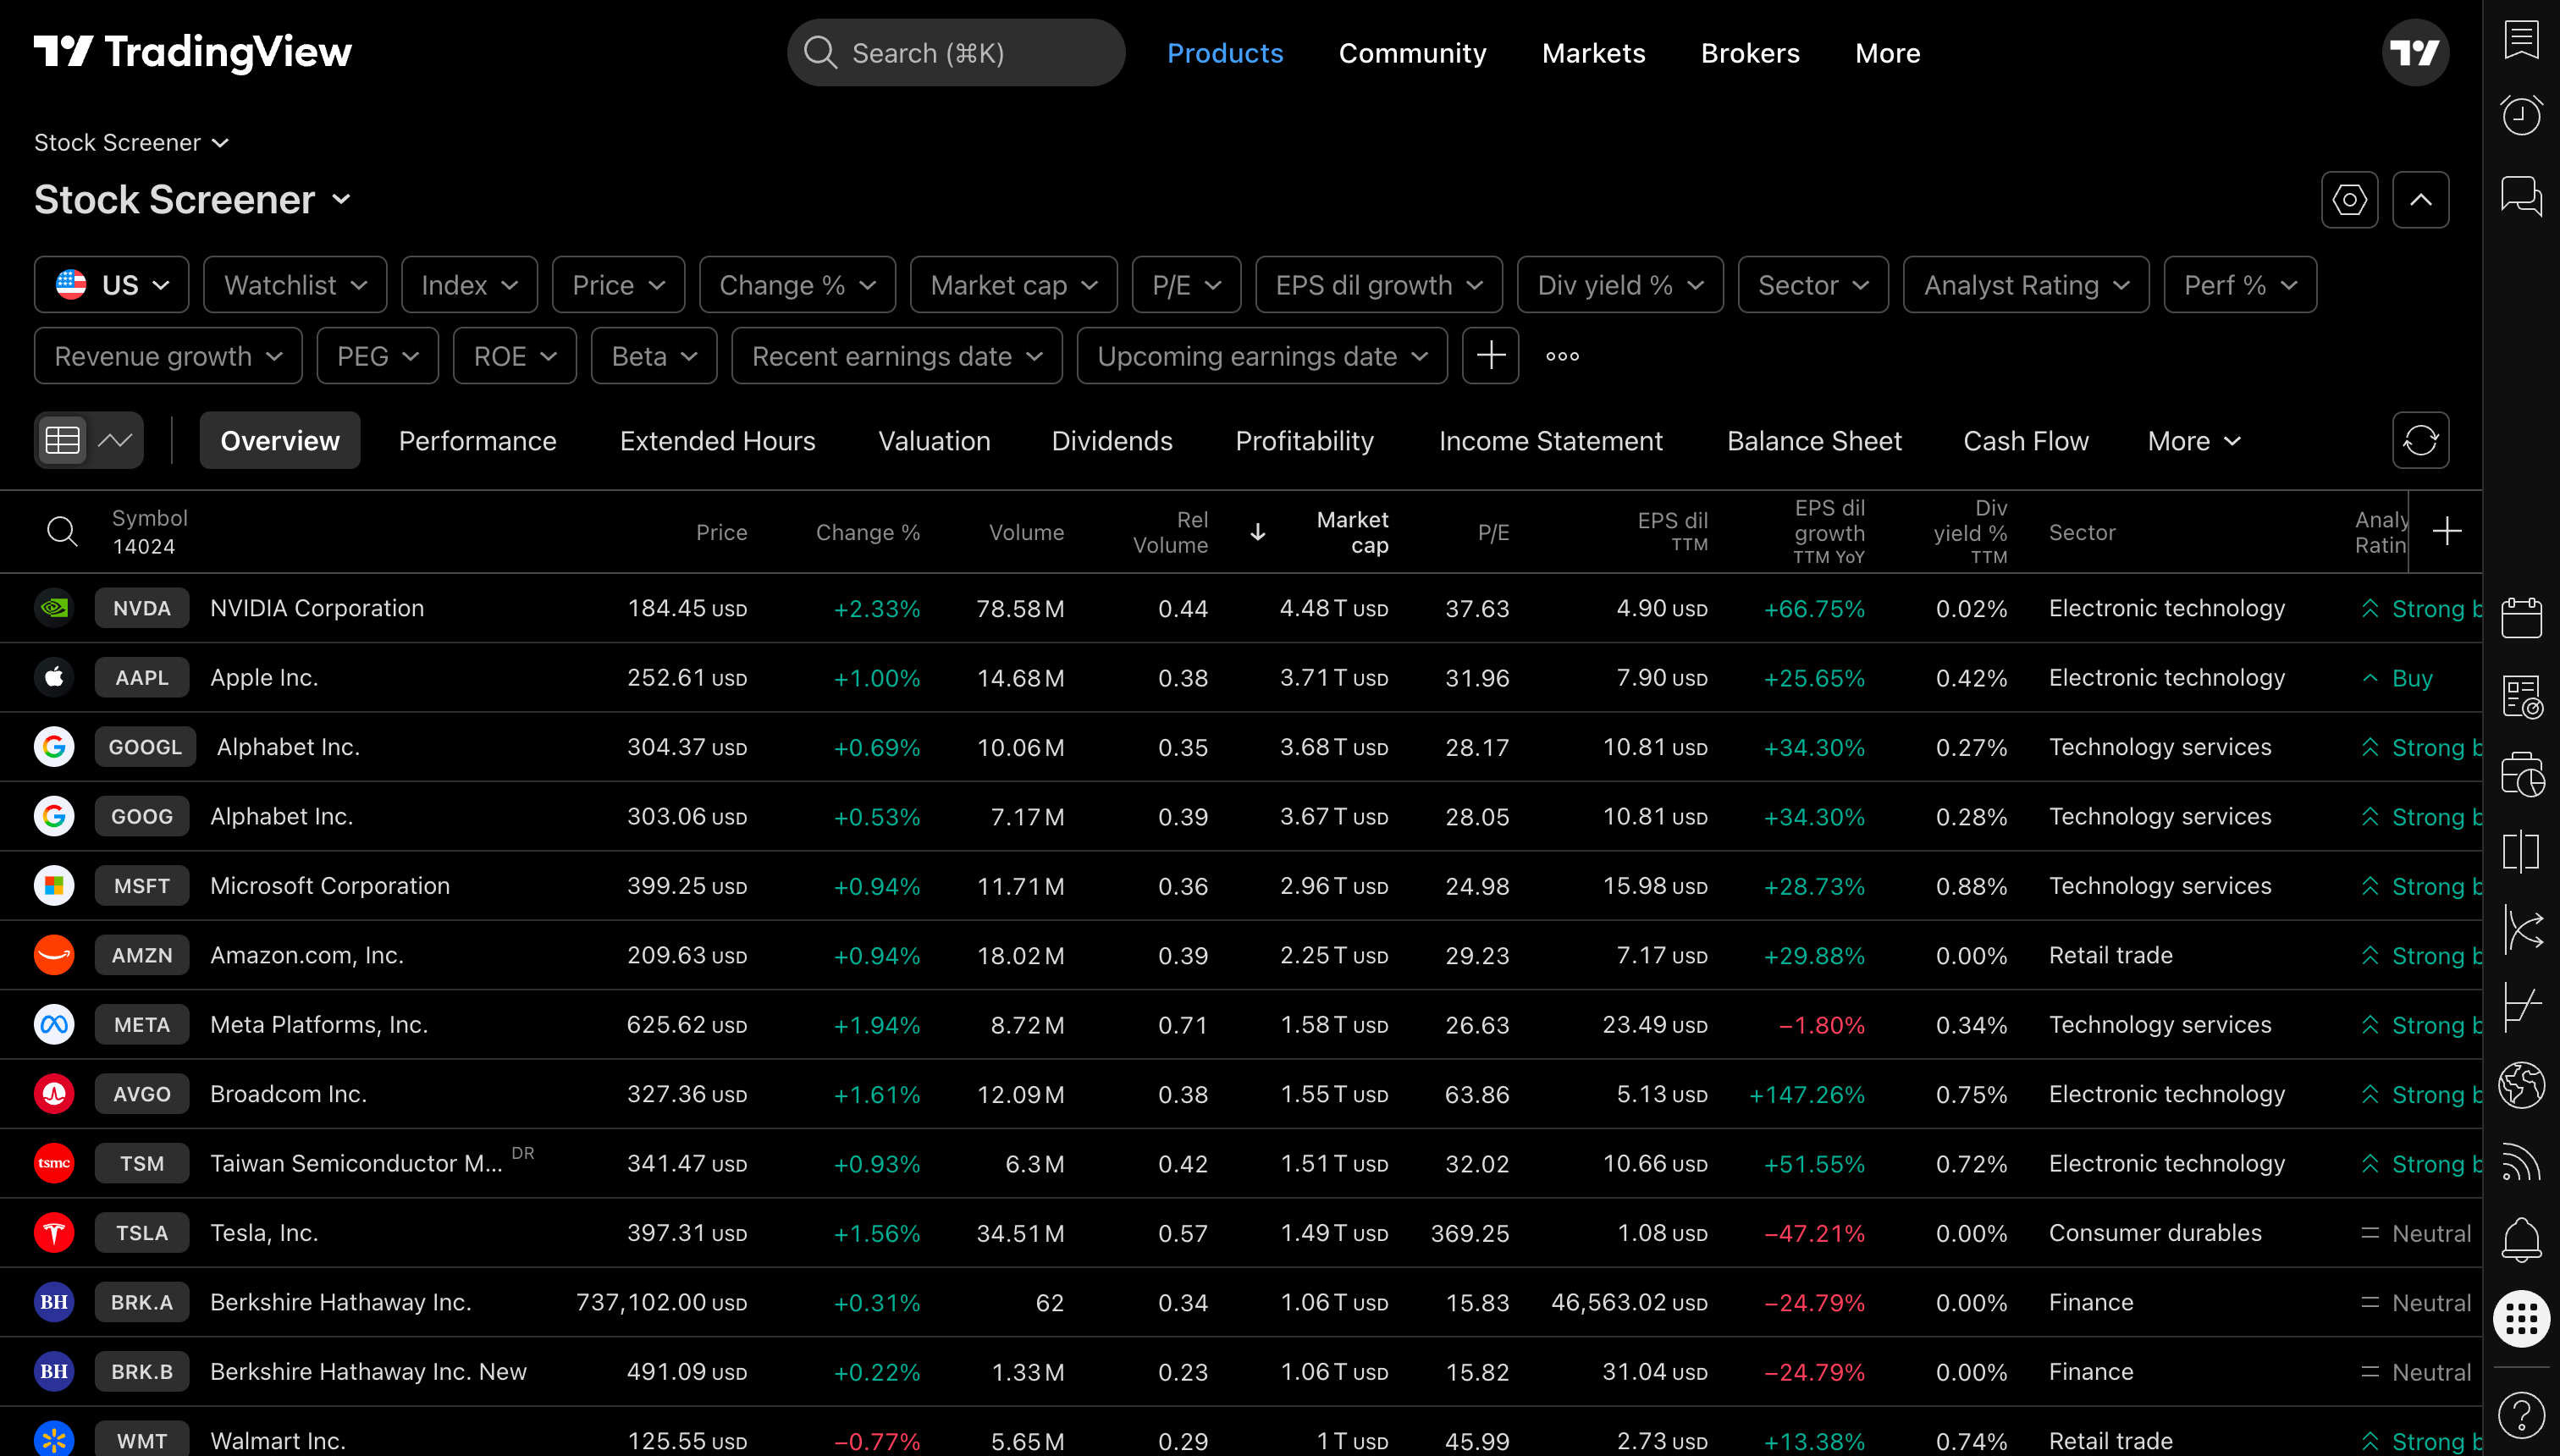
Compare The Stock Against Its World
A stock can look strong because the whole sector is ripping, or weak because the market just sold off.
Compare against:
- SPY or another broad-market ETF
- the relevant sector ETF
- one or two close peers
Outperforming a weak sector is different from floating with a strong market. Context matters.
Convert The Review Into A Decision Label
After the chart pass, label the result:
| Chart review result | Meaning |
|---|---|
| Confirms the signal | Chart behavior supports the model direction |
| Conflicts with the signal | Chart behavior argues against or complicates the signal |
| Inconclusive | Chart does not add useful evidence either way |
| Too extended | Direction may be plausible, but timing risk looks high |
| Event distorted | Earnings, news, or macro events dominate recent behavior |
That label is better than a vague feeling that the chart "looks good."
Where TradingView Fits
TradingView is useful because it makes the inspection pass fast: open the ticker, compare timeframes, draw levels, review volume, set alerts, and save watchlists.
Contextual next step: Open the signal ticker in TradingView, mark the key levels, then decide whether the chart confirms, conflicts, or says "not yet."
Inspect a chart in TradingView
Affiliate link. TradingView says eligible referred users receive a $15 discount coupon when they register and purchase through a partner link. Eligibility, coupon terms, and offers can change.
Final Reminder
WealthGlider is educational software. A model signal plus a chart review is still not personalized financial advice. It does not know your portfolio, taxes, time horizon, liquidity needs, or risk tolerance.
Use signals as research prompts. Make decisions independently.