Free broker charts are fine until the chart becomes part of your process.
If you only need to see today's price, almost anything works. If you are reviewing a signal, comparing a stock to its sector, checking volume, saving a watchlist, and returning tomorrow with the same markings intact, the tool starts to matter.
Affiliate disclosure: WealthGlider may earn compensation if you sign up or purchase through TradingView links on this page. Affiliate compensation does not affect model output, ticker ranking, or signal direction.
What Broker Charts Usually Do Well
Broker charts are convenient because they are already next to your account.
They usually handle:
- quick ticker lookup
- simple candlestick charts
- basic indicators
- recent news overlays
- order-entry context
That is useful. It is also not the same as a research workspace.
Where Free Broker Charts Often Feel Thin
The problems show up when you try to repeat a disciplined workflow:
- layouts are hard to reuse
- annotations may feel clumsy
- cross-symbol comparison can be slow
- watchlists are tied to the broker's interface
- indicator and alert workflows vary wildly
- public chart sharing is often limited
None of that means broker charts are bad. It means they are usually built around brokerage activity first, research workflow second.
What A Dedicated Charting Workspace Adds
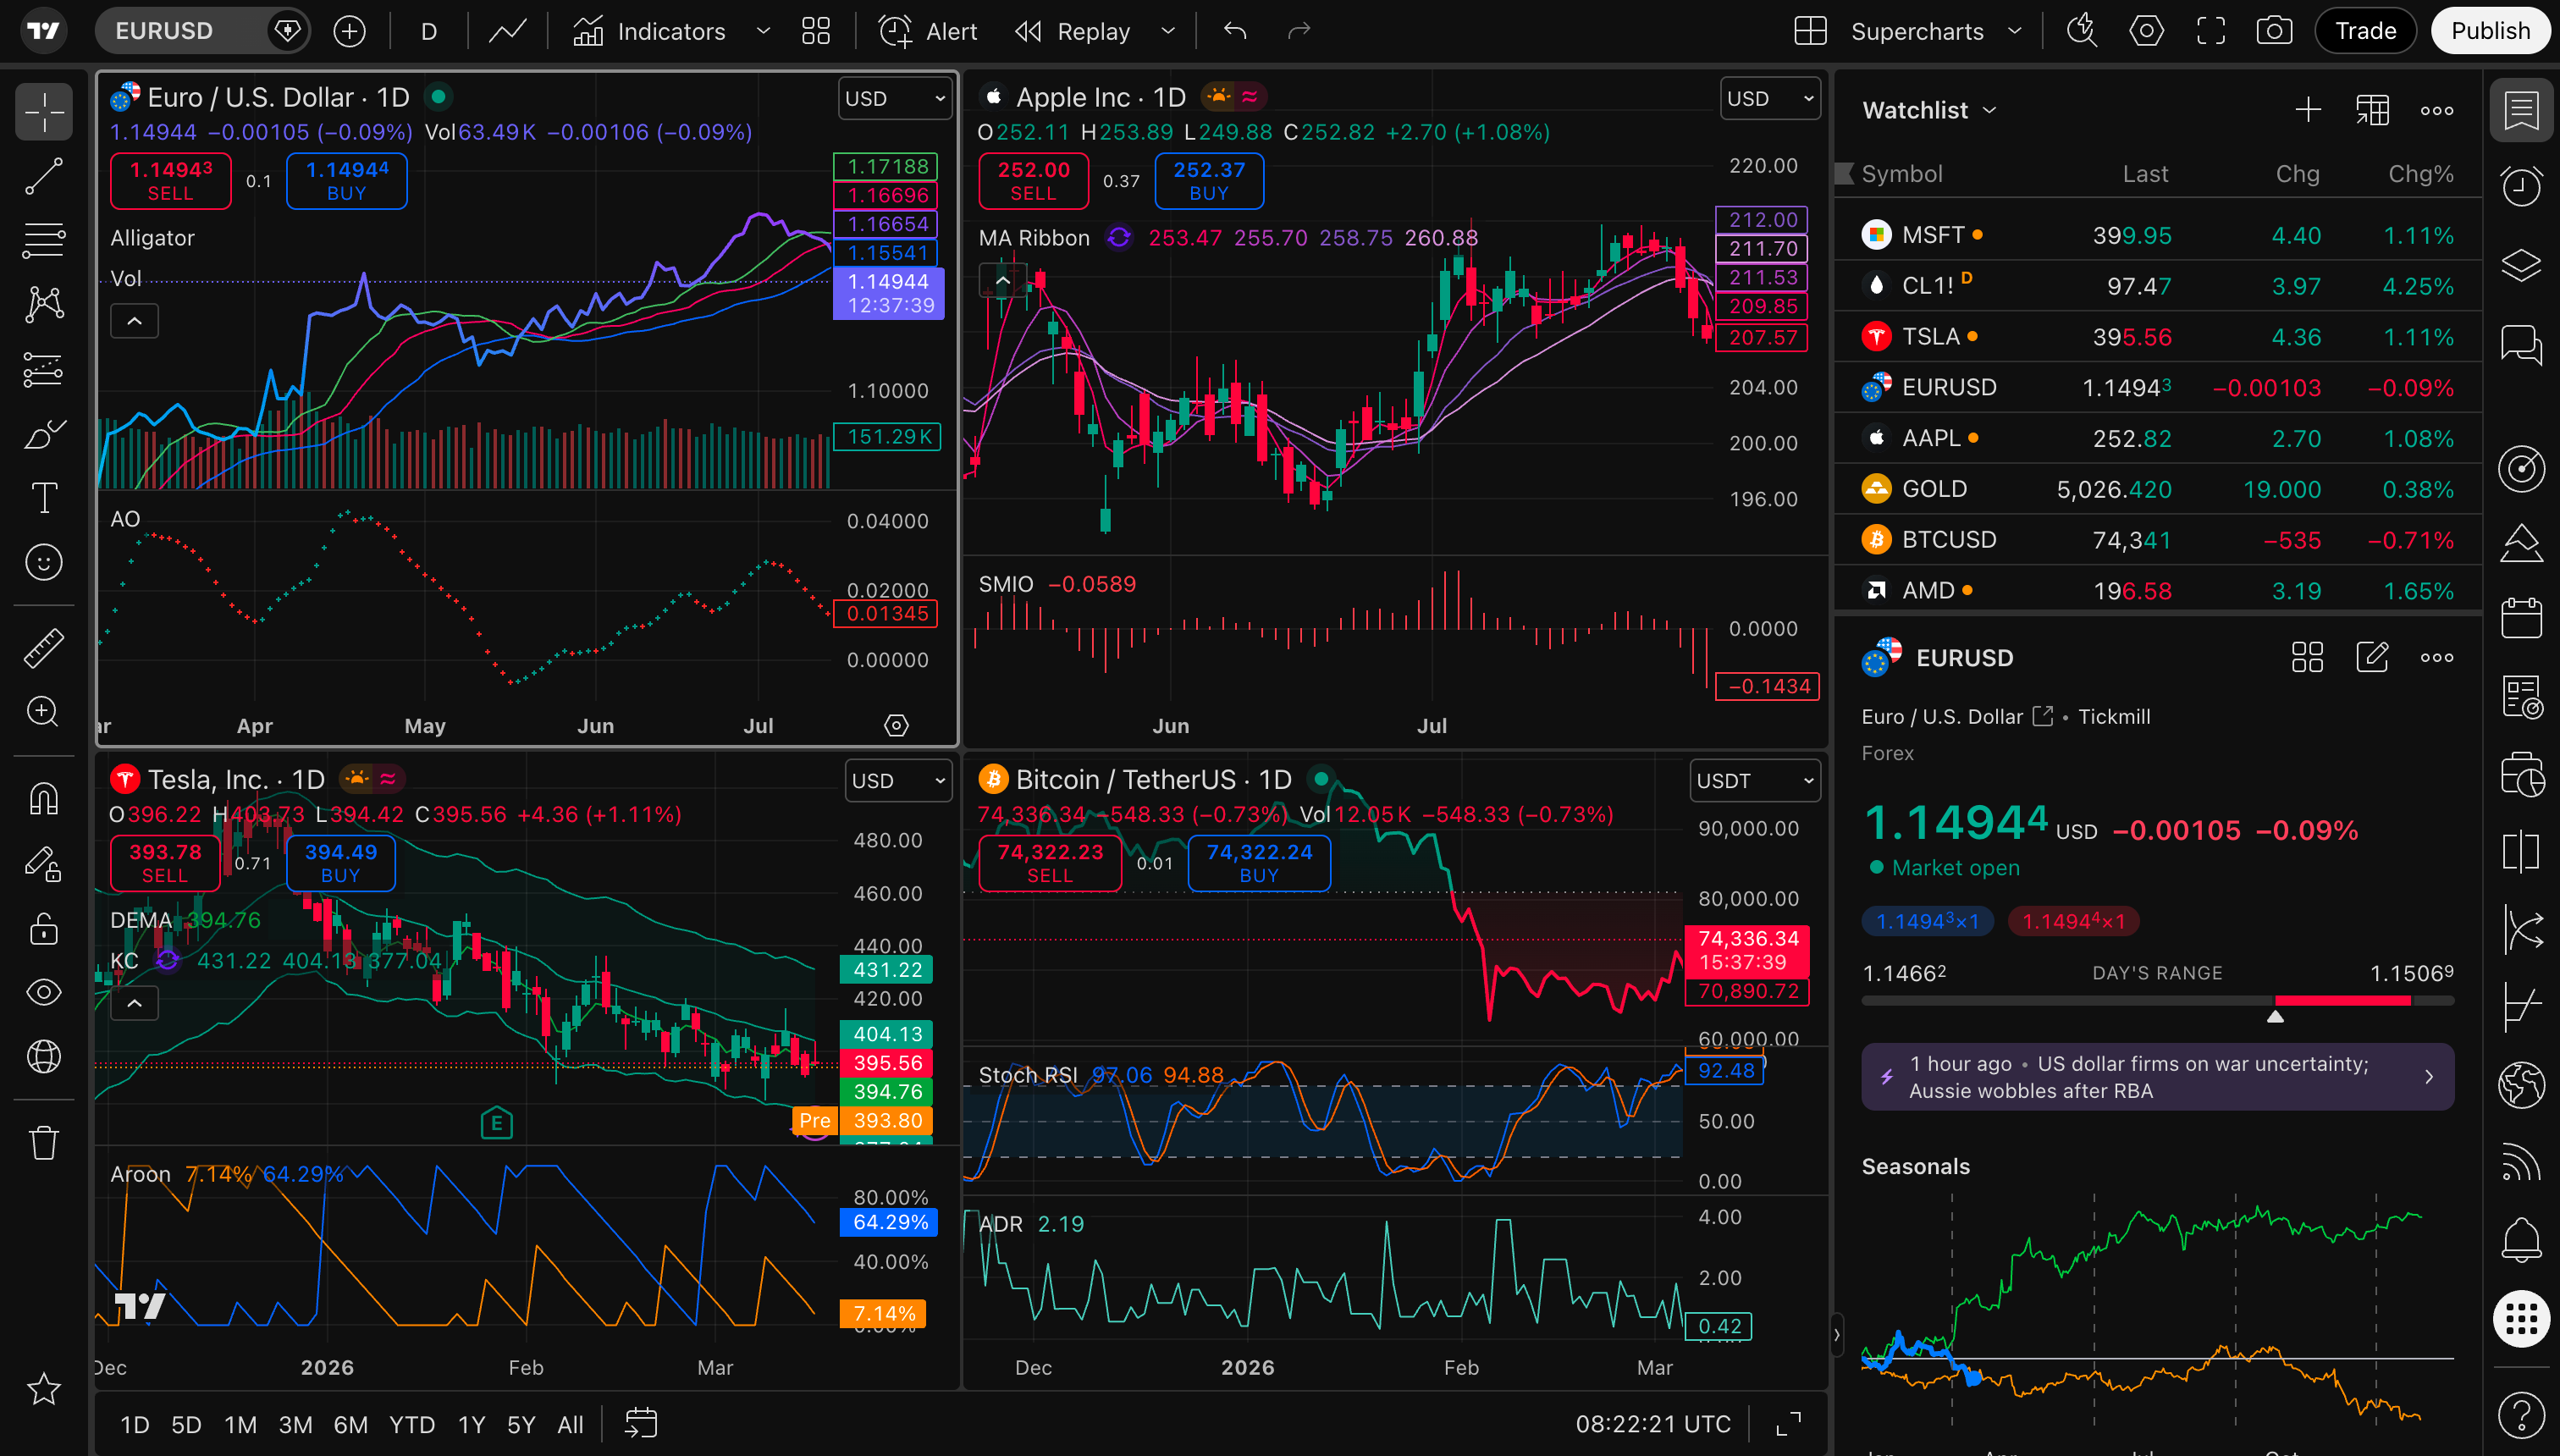
For signal review, a dedicated charting tool can help you move faster and stay more consistent.
The most useful features are boring in the best way:
- saved layouts
- reusable watchlists
- multi-timeframe views
- support and resistance drawings
- alerts
- comparison against indexes and sector ETFs
- cleaner chart sharing for notes or articles
The win is not magic. It is less friction.
A Simple Decision Rule
Use broker charts if:
- you check charts occasionally
- you only need a quick price glance
- your broker charting tools already feel good enough
Consider a charting workspace if:
- you review multiple signals each week
- you keep watchlists
- you mark levels and revisit them
- you compare stocks against sectors
- you want a consistent pre-trade checklist
How WealthGlider Fits
WealthGlider gives you a research prompt: a Buy or Sell candidate with model evidence. A charting workflow helps you decide what the market is already saying about that candidate.
The model asks, "What deserves attention?" The chart asks, "What is price doing right now?"
You need both questions.
Research workflow: If your broker chart feels cramped, try opening the same ticker in TradingView and saving a repeatable signal-review layout.
Compare the workflow in TradingView
Affiliate link. TradingView says eligible referred users receive a $15 discount coupon when they register and purchase through a partner link. Eligibility, coupon terms, and offers can change.
Final Take
Broker charts are good for convenience. A dedicated charting workspace is good for repeatability.
If WealthGlider becomes part of your weekly research routine, repeatability starts to matter.